Everybody wants their Internet startup to go viral. But, just what does going viral mean? In his book, The Tipping Point, Malcolm Gladwell spells out the mechanics of how ideas spread virally by modeling the roles of key individuals that he calls connectors, mavens and salesmen (highly recommended on the Chaotic Flow blogroll Worthy Reads). When it comes to the Internet, Josh Kopelman eruditely points out that you can’t go viral by bolting it on as a last minute marketing program. You must apply SaaS Top Ten Do #5 and build viral growth into the product.
The aspiration of this post is not to add to the complexity of these theories of viral growth, but to uncover the simplicity of viral growth through a little mathematics. This is the second post in a series on SaaS metrics that explores the impact of viral growth in SaaS using a simple heuristic model with the goal of extending the list of SaaS Metrics Rules of Thumb started in the first post in the series regarding SaaS churn.
The mechanics of viral growth vary greatly by product, customer, market, and even culture. But, the mathematics pretty much boil down to the singular idea expressed so well in the kitschy Faberge shampoo commercial from the 70’s and 80’s.
Viral growth is customer growth that is proportionate to the number of customers.
Cn + 1 = ( 1 + g ) x Cn
All the connectors, mavens, salesmen and friends are rolled into the little “g” (for growth rate) in the formula above, which states that the number of customers in the time period n + 1 is equal to the number of customers in the time period n, plus a multiple of those same customers. You can think of g as the percentage of friends who actually told two friends who actually then went out and bought some shampoo divided by the amount of time it took them all to complete this circuit.
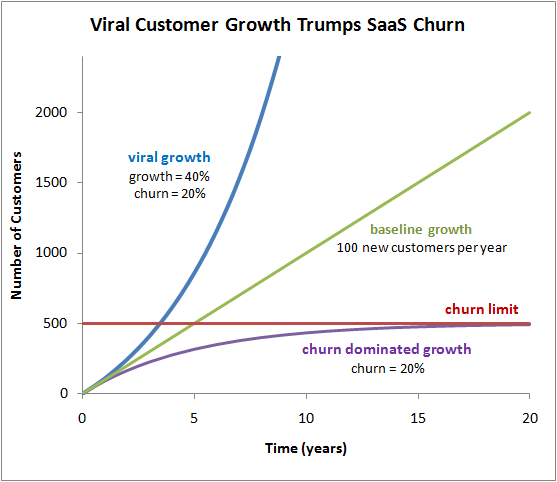
Like churn, viral growth scales with the number of customers.
When the viral growth rate exceeds the churn rate,
growth explodes through the churn limit.
If you read the previous SaaS metrics post on SaaS churn, you might recognize this formula, because it is identical to the churn formula only the negative churn rate -a has been replaced with the positive viral growth rate g. Thankfully, we can skip over the algebra this time and jump to the solution, simply by replacing -a with (g-a). This quick slight-of-hand gives us the formula for the number of customers in the time period n, Cn, that incorporates viral growth as well as churn.
Cn = b/(g-a) x ( ( 1 + g -a )n -1)
In this formula, “b” is the baseline constant customer acquisition rate prior to either viral growth or SaaS churn kicking in. The mirror-like relationship between viral growth and SaaS churn in the formula above leads us to our next SaaS metrics rule of thumb.
SaaS Metrics Rule-of-Thumb #3 – Viral Growth Trumps SaaS Churn
The previous SaaS Metrics Rule-of-Thumb #2 claimed that in order to break through the churn limit, new customer acquisition growth must outpace churn. Because churn increases in direct proportion to the number of customers, the surest approach is to drive growth at a higher rate that also increases in proportion to the number of customers, i.e., virally. Moreover, investors generally expect companies to increase revenue on a percentage basis year over year. Holding products and prices constant, this again requires viral growth of your customer base. Viral growth can come from many sources, but I like to classify it into the following three distinct stages.
Stage 1 Viral Growth – Brute Force Sales and Marketing (small g)
In any given industry, most companies will spend a rather fixed percentage of revenue on sales and marketing, regardless of the size of the company. When the effectiveness of these efforts scales in proportion to the level of spending (which is clearly not always the case), they will drive growth at a rate proportionate to revenue. In a SaaS business, this will also be proportionate to the number of customers. Hence, it is possible to drive growth in proportion to the number of customers simply through nuts and bolts sales and marketing. This stage is arguably not viral growth in the usual marketing sense of the words, but it does meet the strict mathematical definition where customer growth is proportionate to the number of customers. This in fact is the beautiful irony of the Faberge shampoo ad, which was a very effective nuts and bolts marketing campaign, but was probably less successful at getting even one friend to tell one friend about the product, let alone two.
Stage 2 Viral Growth – Customer Advocacy (modest g)
When you are successful at driving word-of-mouth and getting your customers to recommend purchasing your product to new prospects you reach stage 2, the most commonly understood variation of viral growth made famous by the Faberge ad. SaaS customers hold great potential to be advocates, because they confirm their commitment day after day as they continue to use your product and month after month after month as they send in their renewal payments. Driving viral growth through active customer engagement that turns customers into advocates and advocates into evangelists should be high on the agenda of every SaaS marketing plan.
Stage 3 Viral Growth – Ecosystem Buzz (BIG g)
The ecosystem for your product extends beyond your customer base to include all potentially interested parties such as press, analysts, bloggers, social media hounds, partners, vendors, investors, employees, and perhaps even the general public. Most SaaS companies engage in public relations, tracking down and pitching Mr. Gladwell’s mavens and connectors in the hopes that they will pass the word on to their respective audiences and networks. But, true and lasting stage 3 ecosystem buzz is invariably built upon strong stage 2 customer advocacy. Twitter is a great current example. If it weren’t for the dedicated and comparatively small group of Silicon Valley Web 2.0 junkies that were the early adopters of Twitter, you would not be able to follow CNN tweets today.
As previously mentioned, this is the second post in this series on SaaS metrics. In the next post, I’ll start adding revenue and costs to the model to explore the impact of viral growth and SaaS churn on SaaS profitability over time.
SaaS Metric Math Notes
The discrete model presented above can also be treated as a continuous model represented by the linear first order differential equation: C'(t) = b – a C(t) + gC(t) with the solution: C(t) = b/(g-a) ( e(g-a)t – 1 ). The graph above is plotted using this continuous solution. In the discrete model, the factors for viral growth and SaaS churn represent change over a specified constant period of time, e.g., a month or year, whereas in the continuous approach they represent instantaneous change.
For a rapidly growing SaaS business, where year over year growth hides the change from quarter to quarter or even month to month, the continuous model is better suited for estimating actual SaaS metrics. From a practical point of view, you just have to be careful not to put overly averaged growth or churn percentages into the formulas, e.g., for the SaaS churn limit b/a. The distinction really only matters for rates of 30% or more, in which case the continuous rate is given by the formula of gcont = -log(1+gavg).
Going forward, I’ll be dropping the discrete model entirely and will present only graphical solutions to the continuous model, because the continuous metric model is easier to manage and produces more elegant solutions. But, I will not be presenting the calculus required, so as not to put my loyal readers to sleep. Happy to share it with anyone who asks for it by email.
Check out the rest of the SaaS Metrics Rules-of-Thumb
- SaaS Metrics Rule-of-Thumb #1 – SaaS Churn Kills SaaS Company Growth
- SaaS Metrics Rule-of-Thumb #2 – New Customer Acquisition Growth Must Outpace Churn
- SaaS Metrics Rule-of-Thumb #3 – Viral Growth Trumps SaaS Churn
- SaaS Metrics Rule-of-Thumb #4 – Company Time to Profit Follows Customer Break-Even
- SaaS Metrics Rule-of-Thumb #5 – Best Case Time to Profit is Simple Break-Even
- SaaS Metrics Rule-of-Thumb #6 – Growth Creates Pressure to Reduce Total Cost of Service
- SaaS Metrics Rule-of-Thumb #7 – Churn Creates Pressure to Reduce Total Cost of Service
- SaaS Metrics Rule-of-Thumb #8 – Upselling and Upgrades Accelerate SaaS Profitability
- SaaS Metrics Rule-of-Thumb #9 – Joel’s SaaS Magic Number
- SaaS Metrics Rule-of-Thumb #10 – SaaS Customer Lifetime Value Drives SaaS Company Value
[…] I also like this one from Joel York with some insights on relationship of churn:https://chaotic-flow.com/saas-met…Via Ryan Withop.Comment Loading… • Post • 7:10am Ryan Withop, Data Mining […]
[…] SaaS Metrics Rule-of-Thumb #3 – Viral Growth Trumps SaaS Churn […]
Hi George,
I’ve looked at it, but did not include it in the post simply because most companies worry mostly about how to get growth going, as opposed to what happens when it slows.
The solution is a logistic function as the kind found in population growth (as I’m guessing you know). Basically, starts exponential and then flattens out as the target market is converted to customers.
The most relevant part for SaaS would be the value that it flattens out to,
which is Target Market Size x ( 1 – a / g ). Without churn, viral growth would
eventually consume the entire market. But, just as in the case where growth is flat
churn places a limit on growth.
This is the most intuitive point to remember: churn chases the acquisition rate until it kills it (Rule #1). Acquisition growth must outpace churn for the company to keep growing (Rule #2), and since churn is exponential decay, the only way to really outpace it permanently is exponential growth (Rule #3)…otherwise churn will catch it. And, when the total churn churn rate x # customers = acquisition rate….growth stops. For the limited population scenario, growth slows below the exponential threshold as there are fewer and fewer customers to convert. And, stops when the churn rate equals the acquisition rate at the “churn limit” above.
Hi Joel,
This is great by the way. I really like your model, but I was wondering if you’d thought perhaps of incorporating the capacity of the viral universe? i.e the assumption been that. total number of customers can only grow up to a certain point, which probably means that the growth rate (g) or the baseline growth (b) will have to be adjusted for time.
[…] York created a mathematical model showing how growth rates and churn rates interact in viral marketing. Here’s an […]