Too much churn, you lose money. Grow too fast, you lose money. Customer acquisition cost too high, you lose money. Recurring cost of service too high, you lose money. Just shoot me now! How on earth do you make money in SaaS?
If you’ve been following this series on SaaS metrics, then you’ve probably worked your way up to just such a level of frustration. Because, that pretty much sums up the last four SaaS metrics rules-of-thumb on SaaS profitability:
- SaaS Metrics Rule-of-Thumb #4 – Company Time to Profit Follows Customer Break-Even
- SaaS Metrics Rule-of-Thumb #5 – Best Case Time to Profit is Simple Break-Even
- SaaS Metrics Rule-of-Thumb #6 – Growth Creates Pressure to Reduce Total Cost of Service
- SaaS Metrics Rule-of-Thumb #7 – Churn Creates Pressure to Reduce Total Cost of Service
It just can’t be! This is high tech. This is the Internet! Software, not hardware. SaaS can’t just be a low-cost commodity business. There must be a value-based approach. A SaaS revenue solution!
There is. But, it doesn’t mean you can ignore the fundamentals. Driving down total cost of service through automation and economies-of-scale is fundamental. SaaS executives that ignore this put the long term profitability of their SaaS businesses in peril. But, enough on lowering SaaS costs. Let’s talk increasing SaaS revenue!
The previous post in this SaaS metrics series entitled Growing Up Poor – How Foolish SaaS Companies Lose Money was a bold attempt to once and for all solve the mystery of why seemingly successful SaaS companies lose money…in excruciating detail (sorry for that). The cornerstones of the analysis were the relationships established between the values of churn, “a”, growth, “g”, and the baseline average customer break-even time, “BE0” as follows:
BE0 = CAC / [ ARR – ACS ]
| Higher | gBE0 or aBE0 | means longer time to profit. |
| When | gBE0 > 1 or aBE0 > 1 |
the SaaS company will never be profitable. |
| Hence | g = a = 1/BE0 | is the maximum, profitable rate of growth or churn. |
In the formula above, “CAC” is the average acquisition cost per customer, “ARR” is the average recurring revenue per customer, “ACS” is the average recurring cost of service per customer, and the 0 attached to the BE is intended to indicate the absence of churn, i.e., the baseline break-even.
These constraints were the basis of SaaS metrics rules-of-thumb #6 and #7 which claim that both growth and churn, respectively, increase pressure to reduce total cost of service (CAC and ACS) in order to accelerate profitability (reduce
BE0) and to ensure that profitability is even possible (gBE0,aBE0 < 1). However, the viable SaaS revenue strategy of increasing average recurring revenue (ARR) without increasing total cost of service was carefully set aside for later examination. Leading us to…
SaaS Metrics Rule-of-Thumb #8
Upselling and Upgrades Accelerate SaaS Profitability
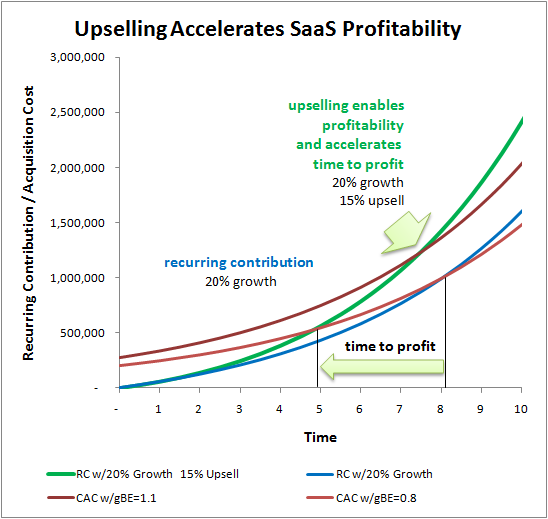
What exactly does it mean to increase average recurring revenue without increasing average customer acquisition cost or average recurring cost of service? First, no additional customer acquisition cost means that we must increase recurring revenue from current customers. Second, no increase in average recurring cost of service means that we must do so in the normal course of business with very little extra effort, preferably through customer self-service (self-selling!). In other words, SaaS companies can accelerate time to profit by upselling and upgrading current customers, but only if it follows an exceptionally low cost purchase process distinct from the new customer acquisition process. The chart below depicts the impact of upselling and upgrades on SaaS time to profit.
Upselling and upgrades leverage the initial investment of customer acquisition cost
to accelerate SaaS time to profit by countering the delays of both growth and churn.
The chart above depicts the effect of upselling on the two uglier examples presented in the last SaaS metrics series installment where times to profit where 8 years and never, respectively. These are determined by the intersections of the blue line, which depicts the recurring contribution (recurring revenue minus recurring cost of service) of a SaaS company with a growth rate of 20%, zero churn, and an average recurring contribution per customer of $1000 – $500 = $500 per year, with the two red lines representing average customer acquisition costs of $2000 and $2,750 respectively.
The green line depicts the impact of increasing SaaS revenue over time through upselling and upgrades. With upselling, the 8 year time to profit scenario is accelerated to just under 5 years, and never has been magically transformed to about 7.5 years as represented by the intersection of the green line with the same red CAC lines. The green line represents the recurring contribution of the same SaaS company, but with an upselling strategy that increases contribution margin, (ARR – ACS), without incurring any one-time acquisition costs by $75 each year, or an upsell percentage of 15%. (see SaaS Metrics Math Notes below)
Finally, some light at the end of the tunnel! Pure upselling as defined here, reduces BE0 by increasing recurring revenue without significantly increasing total cost of service, i.e., money for nothing. What could be more strategic!
Average SaaS Customer Rate of Return
It’s enlightening to rewrite the second formula above which restricts the percentage rates of both churn and growth to provide a clearer focus on SaaS recurring revenue:
| 1/BE0 | = | ARR – ACS | > | a , g |
| CAC |
In this format, we can see that increasing average recurring revenue per customer, ARR, to reduce baseline break-even, BE0, is equivalent to increasing the average rate of return return on our investment of customer acquisition cost. That is, the average recurring contribution, ARR – ACS, can be interpreted as the interest earned on the investment of customer acquisition cost, CAC. Since the SaaS recurring revenue model implies that contribution from current customers must cover the cost of acquiring new customers, then the rate of return on current customers must exceed both the percentage growth and churn rates, otherwise the old can’t fund the new. Upselling and upgrades increase the average rate of return on current customers, accelerating SaaS time to profit and enabling a SaaS company to absorb higher percentage rates of growth and churn.
Two great examples of upselling and upgrades in practice are Salesforce.com and Xignite. Salesforce.com has standard user-based subscription pricing, but then breaks its subscriptions into carefully designed modules of increasing functionality. If you’ve ever been a salesforce.com customer, then you know that 90% of the upgrade process consists of you, as the customer, repeatedly bumping into the limits of your current subscription. When you need more users, or you need the capabilities of enterprise over professional, then you go online or pick up the phone and order them. The cost to salesforce.com is minuscule compared to the original customer acquisition cost (which includes not only customers, but all the prospects that didn’t buy). Salesforce.com is a master of application discovery, which is the process of letting less experienced customers discover for themselves the value of more advanced product capabilities.
Xignite is a cloud services provider of on-demand market data (Who was that guy?!). Unlike monolithic end-user applcations such as Salesforce.com, Xignite’s Web services can be purchased separately and mixed and matched at will. The company offers a market data catalog of more than 50 services with usage-based subscription plans, all of which can be easily purchased online. The range of potential recurring revenue from the lowest plan for a single service to the largest plan for all services gives an upsell potential for each customer of around 1000:1 or total potential upsell of 100,000%!
This post concludes the mini-series on SaaS profitability, but it is not the end of the SaaS metrics series. Surely, we’re only up to SaaS Metrics Rule-of-Thumb #8 and we can’t possibly stop until we round it off to #10. The next post in the series entitled Joel’s Magic Number for SaaS Companies will focus more deeply on what IMHO is the most important SaaS metric of all: average customer rate of return, and will go beyond the math to provide some simple benchmarks to help your SaaS business grow up healthy and profitable.
SaaS Metrics Math Notes
The approach used to model upselling and upgrades is considerably more conservative than that used to model customer growth. In particular, no viral market mechanism exists to promote exponential growth of ARR as with customer acquisition growth or churn. Moreover, upselling is severely limited by the size of the customer and breadth of the product offering. Therefore, a linear growth model based on the original subscription ARR was used.
In addition, the example assumes an increase in recurring contribution with no improvement in margin, i.e., the add-on business incurs recurring costs proportionate with its recurring revenue, only new acquisition costs are avoided. A more aggressive model might have simply increased recurring revenue and avoided additional recurring costs of service. Specifically, the formula for upselling used above is as follows:
ARR(t) – ACS(t) = (ARR0 – ACS0) x ( 1 + ut )
Where “u” is the percentage upsell rate. Integrating the above contribution over time and setting the resulting profit equal to zero gives the upsell accelerated time to break-even:
(ARR0 – ACS0) x ( BEu+ uBEu2/2 ) – CAC = 0
uBEu2/2 + BEu – BE0 = 0
Using the quadratic formula (which I honestly can’t remember using in the past 20 years) this gives the formula for break-even under upselling:
BEu = [ -1 + ( 1 + 2uBE0 )1/2 ] / u
In the example above BE0 = 4 years and 5.5 years, respectively. With u = 15%, the impact of upselling is to accelerate break-even to BEu = 3.2 years and 4.2 years, respectively. Thereby increasing the respective tolerable rates of growth and churn from 25% = 1/4 and 18% = 1/5.5 to 31% = 1/3.3 and 24% = 1/4.2. Since the growth rate in the example is 20%, we can see that upselling takes the latter scenario from unprofitable to profitable as indicated in the chart.
Check out the rest of the SaaS Metrics Rules-of-Thumb
- SaaS Metrics Rule-of-Thumb #1 – SaaS Churn Kills SaaS Company Growth
- SaaS Metrics Rule-of-Thumb #2 – New Customer Acquisition Growth Must Outpace Churn
- SaaS Metrics Rule-of-Thumb #3 – Viral Growth Trumps SaaS Churn
- SaaS Metrics Rule-of-Thumb #4 – Company Time to Profit Follows Customer Break-Even
- SaaS Metrics Rule-of-Thumb #5 – Best Case Time to Profit is Simple Break-Even
- SaaS Metrics Rule-of-Thumb #6 – Growth Creates Pressure to Reduce Total Cost of Service
- SaaS Metrics Rule-of-Thumb #7 – Churn Creates Pressure to Reduce Total Cost of Service
- SaaS Metrics Rule-of-Thumb #8 – Upselling and Upgrades Accelerate SaaS Profitability
- SaaS Metrics Rule-of-Thumb #9 – Joel’s SaaS Magic Number
- SaaS Metrics Rule-of-Thumb #10 – SaaS Customer Lifetime Value Drives SaaS Company Value
[…] (CAC) nor the average recurring cost of service per customer (ACS). Joel York explains it clearly in one of his blog posts. When you sell subscriptions for digital services, your margin is usually quite thick, so the […]
[…] The instance under graphs how upsells enhance SaaS profitability, however the precept holds true in any e-commerce venue or area of interest. Upselling supplies extra profitability, extra progress, and faster time to profit. […]
[…] The example below graphs how upsells improve SaaS profitability, but the principle holds true in any e-commerce venue or niche. Upselling provides more profitability, more growth, and faster time to profit. […]
[…] The example below graphs how upsells improve SaaS profitability, but the principle holds true in any e-commerce venue or niche. Upselling provides more profitability, more growth, and faster time to profit. […]
[…] The example below graphs how upsells improve SaaS profitability, but the principle holds true in any e-commerce venue or niche. Upselling provides more profitability, more growth, and faster time to profit. […]
[…] Joel York, CMO of Shelf puts it. “Your customer must have the need, but it must also see the value, and not […]
[…] subscriptions, and product pairings to shoppers in the decision phase. But eCommerce expert Joel York puts that power in predictable formulaic terms, showing that raising AOV by 15% through upselling […]
[…] helps you to accelerate the time to profit and increases lifetime value to your […]
[…] Cross-selling and up-selling to your existing customer base in a targeted and strategic way has proven time and again to increase revenue, increase customer loyalty, and if you’re a SaaS company, accelerate time to profit. […]
[…] helps you to accelerate the time to profit and increases lifetime value to your […]
[…] Image Source […]
[…] to spend MORE money with you. Upgrades and upsells can lead to orders of magnitude difference in SaaS financial metrics. If you can acquire customers at $100/mo and rapidly upgrade them to $1,000/mo, then you may be […]
[…] CEO and founder Joel York explains how Salesforce utilizes their usage based pricing structure to increase Expansion […]
[…] is Chaotic Flow rule of thumb #8 where they explained how upselling and upgrades leverage the initial investment of customer […]
[…] is Chaotic Flow rule of thumb #8 where they explained how upselling and upgrades leverage the initial investment of customer […]
[…] helps you to accelerate the time to profit and increases lifetime value to your […]
[…] “Upsell†is the generic term for anything that improves both customer value and expenditure. Upselling is at the heart of successful SaaS sales. […]
[…] entrepreneur Joel York explains, as long as the cost of upselling is low (it usually is), “SaaS companies can accelerate time to […]
[…] Joel York’s article. […]
From a reporting side where do you normally see upsells included in metrics calculations?
Included in net new customers or an offset to churn?
Thanks
Stephen McDonald
Hi Stephen,
The short answer is…in the growth number.
The long answer is….
Upsell would not appear at all in the standard growth/churn figures as they count the number of customers, not revenue.
In this approach (which is the model used for my SaaS metrics), Upsell it is treated as an increase to the Average ARR per customer over the life of the customer.
However, there are analogous growth/churn measures based on recurring revenue, instead of number of customers.
i.e.,
Growth = New Recurring Revenue in Period 2 / Beginning Recurring Revenue in Period 1
Churn = Lost Recurring Revenue in Period 2 / Beginning Recurring Revenue in Period 1
In this case, it would be normal to break the growth number up into two figures:
Growth from New Customers and Growth from Current Customers = Upsell
Cheers,
Joel
[…] etc. Joel York at Chaotic Flow has examined both the impact and details of customer churn and up selling in some of his blog posts and they are a good resource for the details of these […]
[…] to spend MORE money with you. Upgrades and upsells can lead to orders of magnitude difference in SaaS financial metrics. If you can acquire customers at $100/mo and rapidly upgrade them to $1,000/mo, then you may be […]