Over and over again, I see exciting headlines for SaaS companies like this…
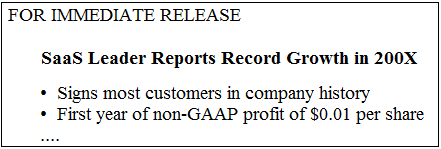
That when I dig a little deeper, I end up having my bubble burst by a dismal financial statement that looks something like this…
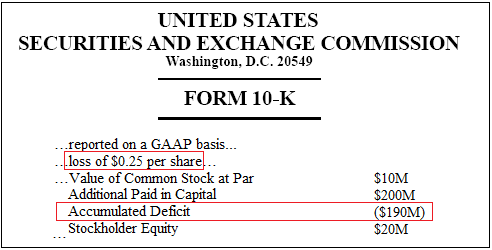
Where is all the money going? Why do so many successful SaaS companies, startup and public alike, have such a difficult time turning a profit?
This is the fourth post in a series on SaaS metrics that will once and for all solve the mystery of why seemingly successful SaaS companies lose money by using a little mathematics. But, before I jump into the technical details, here is the short answer: foolish SaaS companies don’t seriously tackle the problem of reducing Total Cost of Service through automation and economies-of-scale, and they foolheartedly chase after the Recurring Revenue Mirage.
In the last installment in this series, I introduced the following two SaaS metrics rules-of-thumb:
- SaaS Metrics Rule-of-Thumb #4 – Company Time to Profit Follows Customer Break-Even
- SaaS Metrics Rule-of-Thumb #5 – Best Case Time to Profit is Simple Break-Even
Which in concert make the claim that the time to profit for a growing SaaS company will always be greater than the baseline break-even time for the average SaaS customer.
tprofit >= BE0
BE0 = CAC / [ ARR – ACS ]
Where “CAC” is the average acquisition cost per customer, “ARR” is the average recurring revenue per customer, “ACS” is the average recurring cost of service per customer, and the 0 attached to the BE is intended to indicate the absence of churn, i.e., the baseline break-even.
In this post, we’ll zero in on the interplay of growth and profitability with customer acquisition cost and recurring cost of service (collectively total cost of service), starting with…
SaaS Metrics Rule-of-Thumb #6
Growth Creates Pressure to Reduce Total Cost of Service
We know from the earlier SaaS Metrics Rule-of-Thumb #2 – New Customer Acquisition Growth Must Outpace Churn, that successful SaaS companies must strive to grow new customer acquisition at a percentage growth rate, “g”, that exceeds the churn rate. This growth model is quite general. It applies equally well when growth is slow and plodding with a small value of g and when growth is rapid and extremely viral with a high value of g. The only requirement is that our successful SaaS company grow consistently from year to year, which is of course what we all want. In this case, the relationship above between SaaS company profitability and SaaS customer break-even can be made much more exact (see math notes below):
| Higher | g x BE0 | means longer time to profit. |
| When | g x BE0 > 1 | the company will never be profitable. |
| Hence | g = 1/BE0 | is the maximum, profitable rate of growth. |
Since no SaaS company in this universe will throttle back on growth, the only acceptable strategy is to reduce the value of BE0 such that g x BE0 is significantly less than 1, otherwise it may be a looooooong time to profit, perhaps well after the company stops growing altogether (gasp!).
This creates pressure to reduce total cost of service by lowering the average customer acquisition cost, CAC, and lowering the recurring cost of service, ACS. Since growth is the culprit, the surest and most effective defense is to fight fire with fire by reducing total cost of service through automation that provides cost-lowering economies-of-scale. (The one other viable solution, increasing ARR without increasing CAC or ACS will be the topic of the next post in the series entitled SaaS Revenue – The Beauty of Upselling and Upgrades) This latest SaaS metric rule-of-thumb is visually depicted in the chart below.
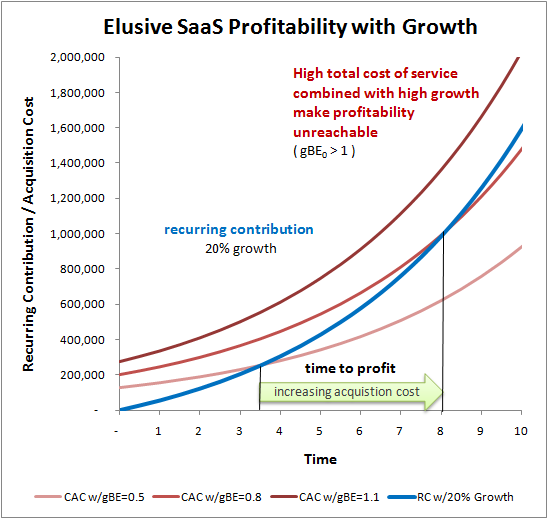
New customer acquisition costs are paid with the recurring contribution of current customers.
If a SaaS company grows rapidly, growing acquisition costs can outpace
the build-up of recurring contribution, such that profitability is impossible.
As outlined in the previous post on SaaS profitability, time to profit occurs when the rate of profit is zero:
[ ARR – ACS ] C(tprofit) – CAC x Cnew(tprofit) = 0
Or, when recurring contribution, [ ARR – ACS ] x C, equals new customer acquisition costs CAC x Cnew. The blue line in the chart above shows the recurring contribution for a SaaS company with a customer acquisition growth rate of 20%, zero churn, and a recurring contribution per customer of $1000 – $500 = $500 per year. The three red lines represent CAC values of $1250, $2000 and $2,750 respectively. In these three scenarios, the baseline break-even values are 2.5 years, 4 years and 5.5 years, giving values for g x BE0 of .5, .8 and 1.1 respectively. We can see that in each case the actual time to profit values of 3.5 years, 8 years and never significantly exceed the respective baseline break-even values. And, in the case of g x BE0 = 1.1 profitability is unattainable. If we add a churn rate of 25% to the mix, such that our growth is drowned out by churn, then we end up paying a hefty bill on both ends of the customer lifecycle, and profitability becomes even more difficult to attain as depicted in the chart below.

New customer acquisition costs must be paid for by current customers.
While growth drives up total acquisition cost,
churn erodes the revenue base available to cover it,
pushing time to profit out even further.
Perhaps not so surprisingly, given the mirror image relationship between viral growth and churn explored in the second post in this series, the impact of churn on profitability mirrors that of growth.
| Higher | a x BE0 | means longer time to profit. |
| When | a x BE0 >1 | the company will never be profitable. |
| Hence | a = 1/BE0 | is the maximum, profitable rate of churn. |
In the example depicted in the chart above, churn has pushed our growth delayed times to profit of 3.5 years, 8 years and never, out to 5.8 years, never and of course still never, respectively. Leading to the mirror image SaaS metrics rule-of-thumb for churn.
SaaS Metrics Rule-of-Thumb #7
Churn Creates Pressure to Reduce Total Cost of Service
New customer acquisition costs must be paid for by current customers. While growth drives up total acquisition cost, churn erodes the revenue base available to cover it, pushing time to profit out even further. Therefore, churn generates the same pressure to reduce total cost of service as does growth
The harsh judgment of this unbiased, objective SaaS metric math seems pretty clear all around. If you want your SaaS company to ever be profitable, then lower your total cost of service already! These new SaaS metric rules-of-thumb provide the basis of the original claim at the beginning of this post. Only fool-hearty SaaS companies believe that they can grow their way to profitability, it is the recurring revenue mirage that can never be reached, because profitability will only be achieved as growth slows or stops entirely. The combination of growth and profitability requires an extreme discipline of lowering total cost of service through economies-of-scale.
If you are now as bummed as I was when I first fully digested this dilemma, then do not fear! It is always darkest before the dawn. Earlier, we set aside one other viable strategy for accelerating profitability: upselling, or rather increasing recurring revenue without increasing customer acquisition cost or average recurring cost of service. The next post in this series entitled SaaS Recurring Revenue – The Beauty of the Upsell will explore the importance of upselling and upgrades as an essential SaaS strategy to accelerate profitability.
SaaS Metrics Math Notes
The profitability constraints placed on growth and churn by the value of baseline average customer break-even, BE0, presented above are derived using the previously described continuous SaaS metrics model:
C'(t) = b – aC(t) + gC(t)
With the solution…
C(t) = [ b/(g-a) ] x ( e(g-a)t – 1 )
Cnew(t) = b + gC(t)
Time to profit is then calculated by substituting these into the zero profit equation:
[ ARR – ACS ] C(tprofit) – CAC x Cnew(tprofit) = 0
Giving the following formula for time to profit:
| tprofit | = | log [ | 1 – aBE0 | ] |
| 1 – gBE0 | ||||
| g – a | ||||
The mathematically inclined can verify that this result satisfies all the principles established in SaaS metrics rules-of-thumb 4 through 7. tprofit increases with both growth and churn commensurate with increasing values of gBE0 and aBE0. When gBE0 >= 1 or gBE0 >= 1 no solution exists, diverging to an infinite time to profit as either of these values approaches 1. tprofit >= BE0 always and reduces to tprofit = BE0 in the limit where a = g = 0.
Check out the rest of the SaaS Metrics Rules-of-Thumb
- SaaS Metrics Rule-of-Thumb #1 – SaaS Churn Kills SaaS Company Growth
- SaaS Metrics Rule-of-Thumb #2 – New Customer Acquisition Growth Must Outpace Churn
- SaaS Metrics Rule-of-Thumb #3 – Viral Growth Trumps SaaS Churn
- SaaS Metrics Rule-of-Thumb #4 – Company Time to Profit Follows Customer Break-Even
- SaaS Metrics Rule-of-Thumb #5 – Best Case Time to Profit is Simple Break-Even
- SaaS Metrics Rule-of-Thumb #6 – Growth Creates Pressure to Reduce Total Cost of Service
- SaaS Metrics Rule-of-Thumb #7 – Churn Creates Pressure to Reduce Total Cost of Service
- SaaS Metrics Rule-of-Thumb #8 – Upselling and Upgrades Accelerate SaaS Profitability
- SaaS Metrics Rule-of-Thumb #9 – Joel’s SaaS Magic Number
- SaaS Metrics Rule-of-Thumb #10 – SaaS Customer Lifetime Value Drives SaaS Company Value
[…] acquisition cost is line is essential to the financial success of every SaaS business, because customer acquisition eats cash. The lower your customer acquisition cost, the sooner you get repaid for your upfront investment in […]
Now, I have seen people try and run these metrics manually, but that is just silly if you ask me. To get people into their product, many SaaS companies turn to discounts to increase acquisition. It costs a lot of money to land an enterprise customer.
[…] acquisition cost is line is essential to the financial success of every SaaS business, because customer acquisition eats cash. The lower your customer acquisition cost, the sooner you get repaid for your upfront investment in […]
[…] acquisition cost is line is essential to the financial success of every SaaS business, because customer acquisition eats cash. The lower your customer acquisition cost, the sooner you get repaid for your upfront investment in […]
[…] power of the Internet to help customers help themselves combined with the promised land of lower customer acquisition cost and lower cost of service will always enrapture the true SaaS believers and hasten them on their […]
[…] months! Ouch. While it makes sense to invest heavily in customer acquisition during high growth, SaaS Metrics Rule of Thumb #6 | Growth Creates Pressure to Reduce Total Cost of Service, highlights the importance of keeping average CAC per customer in check as you grow. Even if […]
[…] power of the Internet to help customers help themselves combined with the promised land of lower customer acquisition cost and lower cost of service will always enrapture the true SaaS believers and hasten them on their […]
[…] power of the Internet to help customers help themselves combined with the promised land of lower customer acquisition cost and lower cost of service will always enrapture the true SaaS believers and hasten them on their […]
It is almost like they are treating business like a hobby and if it works, great if not, well that is ok too. I have also seen allot of good looking companies loose because of immature decision making and foolish spending. SaaS suffers from this type of bad business practices in that this breeds fear in potential investors for the industry as a whole.
[…] months! Ouch. While it makes sense to invest heavily in customer acquisition during high growth, SaaS Metrics Rule of Thumb #6 | Growth Creates Pressure to Reduce Total Cost of Service, highlights the importance of keeping average CAC per customer in check as you grow. Even if […]
[…] Schueler, High Tech Customer Service Expert Web… Other resources: opexengine.com and https://chaotic-flow.com/growing-…Insert a dynamic date hereView All 0 CommentsCannot add comment at this time. Add […]
Joel – we are delighted with your posts. We have taken your equations and run all our data through them. While we had some to similar conclusions through other calculations – these are better. Gives us a real sense of clarity as to the direction of our business.
I am most amused by “Growing Up Poor” – I have lived it though a previous VC funded SaaS company – and it as never made sense to me. Now i run a real-business with solid financial fundamentals and efficient use of capital.
Regards
Joel Lessem
[…] The architecture needs to allow those services to be used as long as necessary, but to be replaced as growth provides the option to drive down the cost of service. It should also be said that features and customization in this approach come from choices of […]
Wow, pretty sad aint it.
jess
http://www.complete-anonymity.cz.tc